Electricity Usage Monitor in Australia: How to Track Your Home Energy Use
Reviewing a quarterly electricity bill in Australia can make it difficult to see exactly when and where electricity was used. During periods of high heating or cooling demand, changes in household consumption and electricity tariffs can have a noticeable impact on bills. An electricity usage monitor provides more detailed visibility into power consumption by showing how much electricity a home is using and when demand changes. This guide explains how electricity monitors work, how to track household consumption across different tariff periods, and how real-time energy data can support more informed energy management.
What Is an Electricity Usage Monitor and How Does It Work?
Before looking at specific monitoring equipment, it helps to understand what these systems do. An electricity usage monitor is a dedicated device or integrated digital system that tracks household electricity consumption and provides visibility into how much electricity is being used over time.
What Does an Electricity Usage Monitor Measure?
Many home energy monitors measure electrical parameters across the home's main supply or selected circuits, including:
Current (Amps) and Voltage (Volts): Some systems use clamp-on Current Transformer (CT) sensors around conductors in the switchboard to measure electrical current.
Active Power (Watts/Kilowatts): The rate at which electrical power is being used at a given moment.
Cumulative Energy (Kilowatt-hours): The amount of electricity consumed over a defined period, such as an hour, day, or billing cycle.
Grid Import vs. Solar Export: Depending on the system configuration, bidirectional monitoring can show whether a home is importing electricity from the grid or exporting excess solar generation.
Watts, Kilowatts and Kilowatt-Hours Explained
A common point of confusion is the difference between power and energy:
| Unit | What It Measures | Example |
|---|---|---|
| Watts (W) | Instantaneous power demand | A modern LED downlight may use 10 W |
| Kilowatts (kW) | Power measured in thousands of watts | A 2,200 W kettle uses 2.2 kW |
| Kilowatt-hours (kWh) | Energy consumed over time; this is what your electricity retailer bills you for | A 2 kW air conditioner running for 3 hours uses 6 kWh |
For example, if a 2 kW split-system air conditioner operates for 3 hours, it would use 6 kWh of electricity at a constant 2 kW load (2 kW × 3 hours = 6 kWh).
Why Monitor Your Home Electricity Usage?
Relying only on a quarterly electricity bill provides limited visibility into when and where electricity is being consumed. Monitoring electricity use as it occurs can help identify standby loads, understand daytime solar generation and consumption patterns, and identify periods of higher grid demand. For homes with solar battery storage, these insights can also help show when stored energy may be available to support household demand.
How to Monitor Electricity Usage at Home in Australia
Australian homes have a few distinct routes to keep tabs on their daily burn, ranging from basic bill analysis to fully integrated whole-home energy systems.
| Monitoring Method | Data Granularity | Setup Effort | Typical Cost | Best For |
|---|---|---|---|---|
| Quarterly Bill | Historical | None | $0 | Broad seasonal comparisons |
| Smart Meter / Retailer Portal | Interval data, depending on meter and retailer | None if available | $0 | Reviewing usage patterns and tariff periods |
| CT-Clamp Home Monitor | CT-Clamp Home Monitor | Electrician may be required | Varies by device and installation | Live visibility into household loads |
| Integrated EMS (e.g. EcoFlow) | Real-time monitoring and system control, depending on configuration | Installation requirements vary | Depends on system | Coordinating solar, storage and household energy use |
Check Your Electricity Bill
Your paper or PDF bill is the most basic way to review historical electricity consumption. Under the National Energy Retail Rules, residential electricity bills in relevant jurisdictions include electricity consumption benchmark information that allows customers to compare their usage with similar households in their local area. The AER’s benchmarks are based on factors including household size and climate zone information.
Use a Smart Meter
A digital smart meter can record electricity consumption at regular intervals and transmit metering data through the electricity market's metering arrangements. Many interval meters provide 30-minute data, although metering intervals and the way customers can access the data vary. The Australian Government also provides guidance on smart meters and household energy monitoring.
Smart meters can reduce the need for estimated meter reads, but the information available on the meter itself and through a retailer's portal depends on the meter, retailer and service. For customers who want more immediate visibility, an in-home display or dedicated home energy monitor may provide a more accessible view of current electricity use. Australia's Department of Climate Change, Energy, the Environment and Water notes that in-home displays can show household energy use and costs and, in some cases, tariff information and usage by appliance or device.
Use Your Electricity Retailer's App or Online Portal
Many electricity retailers provide online portals or mobile apps that allow customers to review interval consumption data where this data is available. These dashboards can help you identify patterns such as higher electricity use on particular days or during specific tariff periods. However, the availability and timing of the data can vary by retailer, meter and data service, so retailer portals should not be assumed to provide real-time information. For more immediate feedback, a dedicated home energy monitor or compatible in-home display may be more suitable.
Install a Home Energy Monitor
For more immediate updates, a dedicated home energy monitor may use CT clamps installed around conductors in the switchboard to measure household electricity use and send data to an app or display. The update frequency depends on the monitor and its configuration.
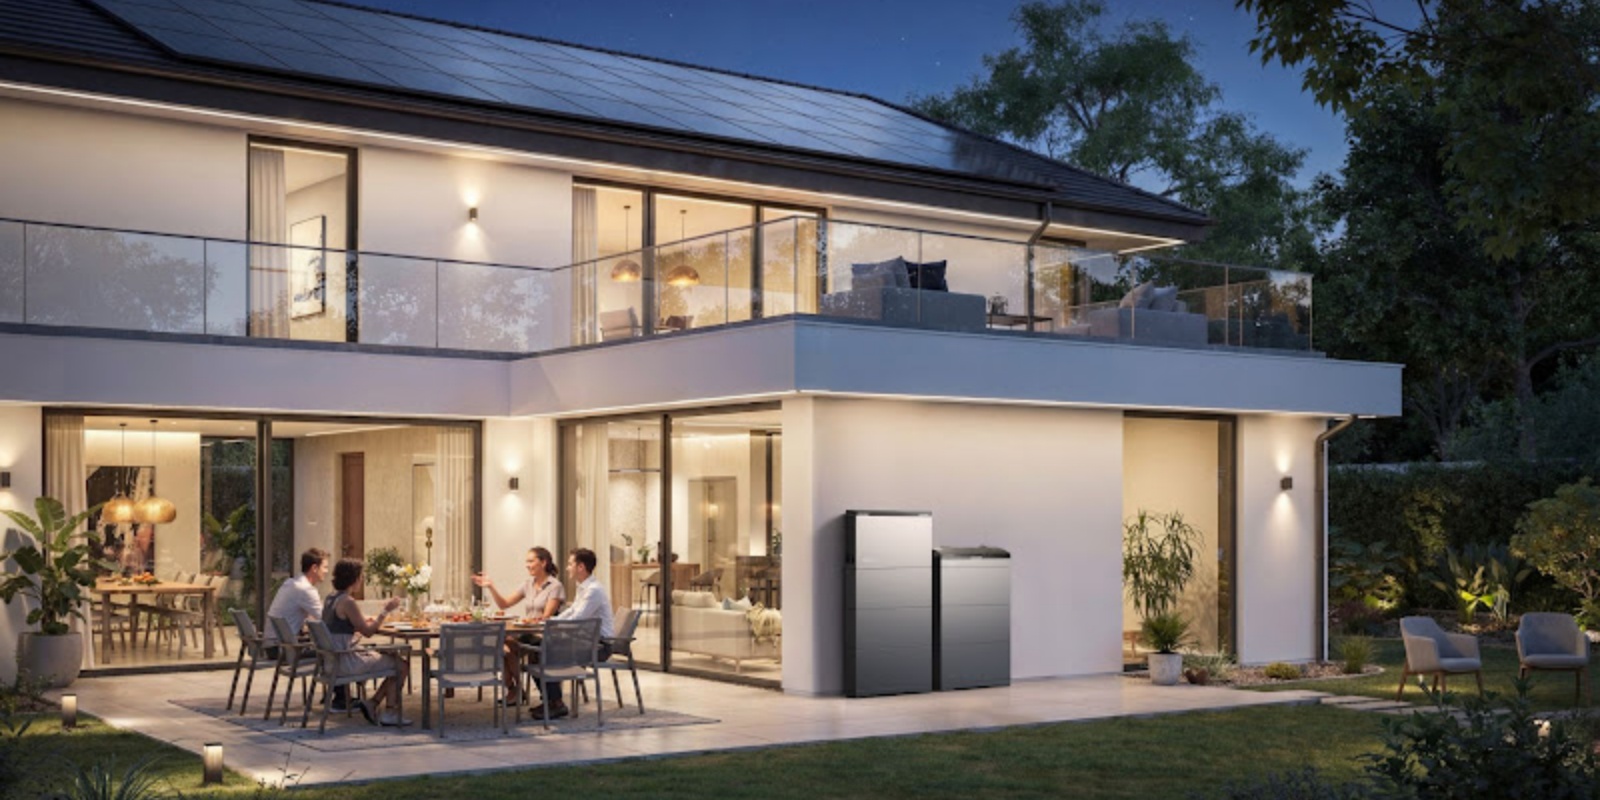
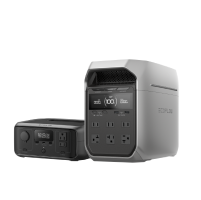
If your home has or plans to add rooftop solar and battery storage, simple monitoring is often not enough. The key priority is balancing daytime solar output with costly evening peak tariffs. An integrated energy management system (EMS) automates this by coordinating solar generation, battery reserves, and household loads in real time. The EcoFlow OCEAN 2 Plus single phase is built for this setup. Designed for Australian single-phase homes, it combines solar storage with automated scheduling—storing excess daytime solar to power the home through peak tariff hours and keeping expensive grid imports to a minimum.
How to Track and Understand Your Home Electricity Consumption
Once live figures start flowing, turning raw numbers into practical household habits takes a bit of simple arithmetic.
How to Calculate Electricity Usage in kWh
Working out how much energy an appliance uses requires its power rating and operating time:
Energy (kWh) = Power (W) × Hours Run ÷ 1,000
For example, if an appliance draws 150 W and operates for 8 hours:
150 W × 8 hours ÷ 1,000 = 1.2 kWh
The appliance would therefore use approximately 1.2 kWh during those 8 hours, assuming it maintains a constant 150 W load.
How to Estimate the Cost of Running an Appliance
Once you know an appliance's energy consumption, you can estimate its usage cost by multiplying the energy consumed by the applicable electricity rate:
Cost = Energy (kWh) × Electricity Rate ($/kWh)
For example, if a 2,000 W appliance operates for 4 hours and the applicable usage rate is $0.32 per kWh:
2 kW × 4 hours × $0.32 = $2.56
The estimated usage cost would therefore be approximately $2.56 for those four hours at that rate. Your actual bill impact may differ depending on your electricity plan, tariff structure, supply charges, discounts, and when the appliance operates. For AGL customers, our guide to agl energy rates explains how usage and supply charges fit together.
How to Identify Your Biggest Energy Users
Common sources of higher household electricity consumption include:
Space Heating and Cooling: Reverse-cycle air conditioners, ducted systems, and electric heaters can use substantial amounts of electricity, particularly when operated for long periods.
Water Heating: Electric hot water systems can represent a significant household load, depending on the system type, household size, water use, and operating schedule.
Large Motor Appliances: Pool pumps, bore pumps, and older tumble dryers.
Cooking & Refrigeration: Induction cooktops, electric ovens, and secondary drinks fridges sitting in hot garages.
How to Establish a Household Energy Baseline
Your baseline, or “baseload,” refers to the electricity demand that remains when major appliances and other active loads are not operating. It can include devices such as Wi-Fi routers, refrigerators, smart-home hubs and standby equipment.
To establish your household baseline, check your electricity demand during a period when most occupants and major appliances are inactive, such as overnight. There is no single baseload level that applies to every Australian home, because the result depends on the home’s appliances, heating and cooling systems, hot-water system and other equipment. A higher-than-expected reading can be a reason to investigate which devices or circuits are contributing to the load.
How to Use an Electricity Usage Monitor to Reduce Energy Bills
Data is only useful if it sparks a change in your household routine. Here is how monitoring translates directly into lower quarterly expenses.
Find and Reduce High-Energy Appliance Usage
Watching real-time demand change when an appliance switches on can make its electricity use easier to understand. For example, a portable 2,400 W fan heater can create a noticeable increase in household demand when operating. Comparing its usage with other heating options, or using timers and controls to avoid unnecessary operation, can help households understand where electricity is being used and identify potential opportunities to reduce consumption.
Monitor Peak and Off-Peak Electricity Use
Time-of-Use tariffs can vary significantly by retailer, distribution area and electricity plan. Peak, shoulder and off-peak periods also differ between plans, with the exact time periods determined by the individual electricity plan. The Australian Government provides guidance on time-of-use pricing.
As an example, current plans listed on Energy Made Easy show peak usage rates above 40c/kWh and, for some plans, above 55c/kWh. Other plans have different peak periods and rates.
Before shifting appliance use, check the actual tariff periods and rates on your electricity plan rather than relying on a general peak or off-peak schedule.
Detect Unusual or Unexpected Electricity Consumption
Appliance or equipment faults can sometimes result in unusually high or continuous electricity demand. For example, if a 3.6 kW heating element were to operate continuously, the electricity consumption could become substantial. At a usage rate of $0.32/kWh, continuous operation for 24 hours would represent about $27.65 of usage cost per day, before other charges or adjustments. Real-time monitoring can help identify unusual continuous loads earlier than a quarterly bill review.
Track the Impact of Energy-Efficiency Improvements
Upgrading a hot-water system or replacing older lighting can involve an upfront cost. A usage monitor can help you compare electricity consumption before and after the change, providing household-specific data on how the change affects electricity use rather than relying only on estimated performance figures.
How to Choose the Right Electricity Usage Monitor in Australia
Finding the right monitoring solution comes down to how deep you want the insights to go and how your home is powered. If you already have solar and a battery, consider how monitoring fits into your Home Energy Ecosystem.
Smart Meter vs. Dedicated Home Energy Monitor
Smart meters provide metering data used for billing and market processes, while the timing and level of detail available through retailer portals can vary. Dedicated home energy monitors can provide more immediate feedback, depending on the device and its update frequency, allowing you to observe changes in household demand when appliances switch on or off. For households that want more immediate behavioural feedback, a dedicated monitor may provide additional value compared with relying only on a retailer portal.
Features to Look for in an Energy Monitor
When comparing standalone monitors and integrated systems, keep these key points in mind:
Solar & Storage Integration: Where supported, CT sensors and system integrations can measure grid import, grid export and solar generation or self-consumption.
Update Frequency: Consider how frequently the system updates its readings and whether that frequency is sufficient for the level of monitoring you need.
Phase Compatibility: Make sure the monitor supports your home's electrical configuration, including single-phase or three-phase supply where applicable.
Actionable Visualisation: Simple graphs that illustrate where energy is flowing, rather than walls of raw numerical data.
If your goal goes beyond viewing a live power reading and you want to understand household consumption patterns, identify major loads and see when appliances are operating, more detailed data visualisation can be useful.
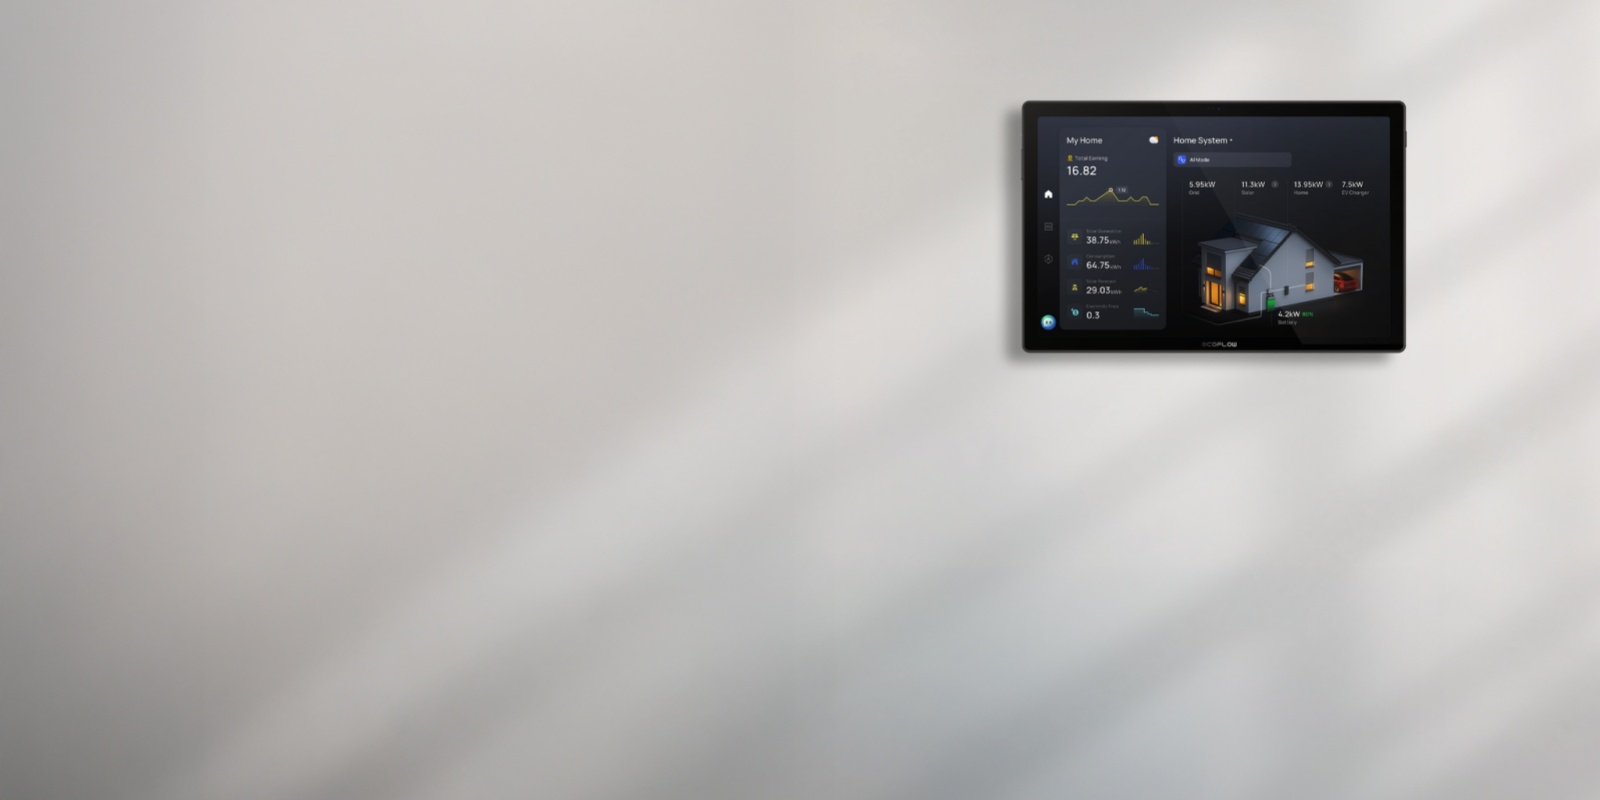
This is where dedicated energy intelligence interfaces come in. The EcoFlow PowerInsight 2, for example, acts as a dedicated central touchscreen and energy analytics hub. Instead of burying generation and consumption numbers inside obscure menus, it presents live energy flow diagrams, breaks down device-level habits, and tracks historical trends. Paired with solar and storage, it helps you spot excess daytime generation at a glance, adapt to local ToU tariff structures, and actively trim your grid imports.
Do You Need an Electricity Usage Monitor?
If your household uses a flat-rate tariff, has relatively predictable electricity consumption and does not need detailed load monitoring, a retailer’s existing tools may provide enough information. A dedicated monitor may be more useful if you want more immediate visibility, use a Time-of-Use tariff, have rooftop solar and battery storage, or want to understand which appliances contribute most to household demand. The potential value will depend on the monitoring features, household usage patterns and the cost of the equipment and installation.
Schedule Your Free Consultation Today!
What kind of product or solution are you interested in?
Conclusion
Monitoring household electricity use can provide a clearer picture of when and where electricity is consumed. Rather than relying only on quarterly bills, households can use smart meter data, retailer tools or dedicated electricity usage monitors to identify consumption patterns and understand how appliances affect demand. For homes with solar and battery storage, monitoring can also help users review the relationship between solar generation, household consumption and grid imports. The right monitoring approach depends on the home’s electrical setup, tariff structure and the level of detail required.
Disclaimer: Electricity tariffs, peak and off-peak periods, metering arrangements and available monitoring services vary by state, retailer and electricity plan. The information in this article is provided for general informational purposes and should not be taken as financial, technical or regulatory advice. Check your electricity retailer, distributor or relevant Australian authority for the latest information applicable to your property.
FAQs
How can I monitor my electricity usage at home?
You can monitor electricity usage through your retailer’s online portal, by reviewing smart meter or interval-meter data, or by installing a dedicated home energy monitor. Depending on the device, a dedicated monitor can provide near-real-time or real-time information through an app or display.
Can I see my electricity usage in real time?
Yes, but the level of real-time visibility depends on the monitoring system. Dedicated home energy monitors and some in-home displays can provide near-real-time information, while retailer apps and smart meter portals may provide interval data with varying levels of delay. The timing depends on the meter, retailer and data service.
Do smart meters show electricity usage?
Smart and interval meters can record electricity consumption at regular intervals, including 30-minute intervals for many installations. However, the information shown on the meter itself varies by meter type, so a physical meter display should not be assumed to provide a detailed real-time view of household power demand.
How do I know which appliance uses the most electricity?
One practical approach is to watch your electricity monitor while switching appliances on and off one at a time. For individual plug-in appliances, a compatible plug-in power meter can also show their electricity use. For fixed or hard-wired equipment, use an appropriate monitoring method and consult a qualified electrician where required.
Can an energy monitor help reduce my electricity bill?
An energy monitor can help households identify consumption patterns and make more informed decisions about when and how electricity is used. Research on direct energy feedback has reported potential household electricity savings in the range of around 5% to 15%, but results vary by feedback method, household behaviour and study design. For example, one field trial reported average savings of around 4.5%.
Can I monitor solar generation and household consumption?
Yes, provided the monitoring system supports solar and grid-flow measurement and is compatible with the home’s solar and battery configuration. Depending on the system, it may show solar generation, household consumption, grid imports and grid exports together.