
Energy Monitoring System: How It Works and Tracks Household Energy Use
An energy monitoring system helps UK households see how much electricity they’re using in real time. It shows which appliances are drawing the most power and where the costs are coming from. Some systems also keep an eye on solar generation and battery performance, so you get a clearer picture of how energy moves around your home. This guide explains how these systems work, what they can track, and how to pick one that suits your household.
Key Takeaway
Real-time visibility: Home energy monitors track consumption down to the second, helping you spot energy-hungry appliances and silent standby drains.
Beyond standard In-Home Displays (IHDs): While utility-issued smart meter screens offer basic kWh tallies, dedicated monitoring systems track individual circuits, solar panels, and home batteries.
Smarter time-of-use tariffs: Pairing live tracking with off-peak rates, like Octopus Go or Economy 7, lets you shift heavy loads such as washing machines and EV charging to cheaper hours.
Optimised self-consumption: Real-time visibility bridges the gap between peak daytime generation and evening demand for solar and storage setups.
What Is a Home Energy Monitoring System?
A home energy monitoring system measures electricity consumption and displays the results through an app or dedicated screen. Unlike a standard smart meter display, some systems can also track individual circuits, appliances, solar generation, and battery activity. For homes combining solar panels with solar battery storage, monitoring can also show when stored energy is covering household demand.
Home Energy Monitoring vs. Smart Meters
Most UK homes with a SMETS2 smart meter have an In-Home Display on the kitchen worktop. It shows your supplier’s tariff and total electricity use, updating every few seconds. Learning how to read a smart meter also helps you distinguish cumulative billing readings from the live power shown by a separate monitor. Dedicated energy monitors go further. Instead of relying on half-hourly readings sent to your supplier through the DCC network, they read currents directly from your consumer unit or smart plugs. That gives you second-by-second analytics, circuit-level breakdowns, and historical logging that a standard smart meter display can’t match.
The Main Components of an Energy Monitoring System
While models vary between brands, almost every setup relies on four core elements:
Current Transformer (CT) Clamps: Small hinged plastic rings that clip securely around live cables without cutting any wires.
Transmitter / Sensor Unit: A compact module that reads the tiny induced current from the clamps and converts it into raw electrical data.
Bridge or Gateway: A hub connected to your home Wi-Fi router (or a local Zigbee/Z-Wave network) that uploads readings to a cloud server or local database.
User Interface: A smartphone app, web portal, or wall-mounted touch panel where daily graphs and real-time wattage come to life.
Types of Home Energy Monitors Available in the UK
| Type | How It Connects | Best For | Typical Installation |
|---|---|---|---|
| Optical / Smart Meter Readers | Clips over the flashing pulse LED on your existing meter | Budget-conscious whole-home overview | DIY in 5 minutes |
| CT Clamp Whole-Home Monitors | Clips around the main meter tails near the consumer unit | Instant whole-home demand & export tracking | Qualified electrician; follow manufacturer instructions |
| Multi-Circuit / Sub-Panel Systems | Multiple CT clamps inside the consumer unit board | Pinpointing exact circuits (kitchen, heat pump, immersion) | Requires qualified electrician; local rules apply |
| Smart Plugs with Power Metering | Sits between wall socket and appliance plug | Granular appliance tracking (kettles, gaming PCs) | Plug-and-play |
How Does an Energy Monitoring System Work?
An energy monitoring system uses sensors to measure electricity flow and turns those readings into data you can see on a screen or app. Depending on the setup, it can track your whole-home consumption or drill down into individual circuits and appliances.
Measuring Electricity Use at the Meter or Consumer Unit
A CT clamp measures electricity flow by picking up the magnetic field around an insulated live cable. It’s usually fitted around the main live cable between the meter and consumer unit. The clamp has to face the right way to tell whether power is being imported from or exported to the grid. Because it doesn’t make direct contact with the conductor, there’s no need to cut or strip the cable. Installation near the meter or consumer unit should be done by a qualified electrician.
Collecting and Transmitting Energy Data
Once the sensor samples the induced current, it pairs that figure with either an assumed mains voltage, commonly averaged to 230V in the UK, or an active reference voltage taken from an adjacent fuse way. The transmitter then encodes those power draws and broadcasts the data packets to your hub over low-power radio frequencies like 433MHz, Zigbee, or 2.4GHz Wi-Fi.
Processing Energy Data and Generating Readings
The system processes the readings and displays your electricity consumption in graphs and charts. Depending on the monitor, you can check real-time power use, track daily and monthly consumption, and estimate costs based on your tariff.

What Can an Energy Monitoring System Track in Your Home?
What you can see depends on the type of monitor you’ve got. Basic systems show total household electricity use. More advanced setups can track individual appliances, standby loads, solar generation, and battery activity throughout the day.
Whole-Home Electricity Consumption
Whole-home monitoring shows your total electricity use, including your baseline and your peak demand periods. For example, consumption might sit around 180W when very little is running, then jump to 7.5kW when the electric shower, tumble dryer, and oven are all on at once.
Individual Appliance Use and Standby Loads
Sub-metering systems and networked smart plugs strip away the mystery of individual running costs. You can quickly see:
How many pence a single wash cycle on the hot setting costs versus an eco cycle.
Exactly what your American-style fridge-freezer pulls each time its compressor kicks in.
The cumulative “vampire draw” of media consoles, set-top boxes, broadband routers, and smart speakers left idling overnight.
Solar Generation and Home Battery Activity
For homes with solar panels and battery storage, energy monitoring can track generation, household consumption, and power imported from or exported to the grid. That helps you see how much solar you’re actually using and when you’re leaning on grid electricity. The EcoFlow PowerInsight 2 features a 10.95-inch touchscreen that displays solar generation, household electricity consumption, and battery status for compatible EcoFlow systems. Homeowners can check all these readings in one place and keep an eye on their energy use throughout the day.
Energy Use Patterns Across the Day
Seeing your energy use over a 24-hour period highlights the rhythms of daily life. You’ll spot the sharp 7 AM breakfast peak with toasters, kettles, and hairdryers going, the quiet midday lull, and the broad evening plateau from around 5:30 PM as cooking, lighting, and entertainment kick in.
How Can Energy Monitoring Help Reduce Household Energy Costs?
Energy monitoring can help lower electricity bills by showing when and where power is being used. With this information, households can identify inefficient appliances, reduce unnecessary consumption, and shift suitable activities to cheaper tariff periods.
Identifying High-Consumption Appliances
Older appliances, such as a chest freezer in the garage, or immersion heaters left on unnecessarily can increase electricity costs. Real-time monitoring helps identify these appliances and check how much energy they consume.
Shifting Electricity Use to Off-Peak Periods
Smart, time-variable tariffs have surged in popularity across England, Scotland, and Wales. If your tariff offers low-rate night windows (such as between 00:30 and 04:30), monitoring your live usage lets you verify that dishwashers, washing machines, and electric vehicles only pull power when prices are rock bottom.
Reducing Standby Power and Avoidable Consumption
A steady overnight base load of 250W equates to 6kWh every single day, costing £547.50 a year at an illustrative 25p/kWh, excluding standing charges; use your own tariff to calculate the actual cost. Identifying that baseline motivates simple fixes, like putting entertainment centres on switched multi-way sockets or adjusting heating circulation pump speeds.
Maximising Solar Self-Consumption and Battery Use
For UK homes with rooftop solar, daytime generation rarely lines up neatly with evening peak demand. Monitoring helps you see how your home loads, PV output, and battery cycling actually interact, so you can work out how to get the most from your own clean power.
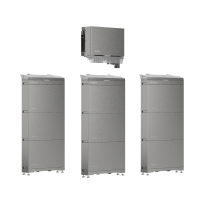
For households keen to push self-sufficiency to the limit, especially those running electric vehicles, heat pumps, or running an active family home, modular capacity is worth considering. The Ecoflow OCEAN 2 Plus single phase offers exceptional flexibility here, supporting an expandable storage capacity of up to 60 kWh with a single inverter. This allows homeowners to start with a tailored configuration and scale their storage reserves seamlessly as domestic energy needs grow.

How Do You Choose the Right Home Energy Monitoring System in the UK?
When you’re picking a home energy monitor, think about what it needs to work with. Check compatibility with your existing setup, how much detail you actually need, and whether it supports solar or battery storage. Installation requirements, the reporting features, and the overall cost are all worth weighing up too.
Checking Meter, Sensor and Installation Compatibility
If your consumer unit sits close to your main meter, standard CT clamps fit easily around the meter tails. In older properties or flats where the meter is located in an external communal cupboard far from your fuse box, wireless range or lack of a nearby 13A socket might necessitate an optical pulse reader or long-range LoRaWAN hardware.
Comparing Data Accuracy, Reporting and Alerts
Budget systems often assume a fixed nominal mains voltage (230V) and cannot measure power factor. Because the UK grid legally fluctuates between 216.2V and 253V (+10% / -6%), and modern electronics (LED drivers, heat pumps, PCs) draw reactive current, these systems calculate apparent power (VA) rather than true real power (Watts). This can skew readings by 5% to 15%. If high precision matters, choose a monitor with direct voltage reference sampling that tracks phase angle and true power in real time.
Checking Smart Home and Energy System Integration
A monitor that lives in its own closed app quickly becomes a chore to check. Look for hardware that supports open protocols or integrates cleanly with platforms like Home Assistant, Apple HomeKit, or Alexa. Being able to automate a smart plug to switch on an appliance whenever solar export exceeds 1.5kW turns passive monitoring into active savings. A connected home energy ecosystem can bring compatible solar, storage, heating and EV charging equipment together for coordinated control.
Comparing Upfront Costs and Potential Savings
Simple plug-in optical monitors start at under £40, whereas multi-channel single-phase (or three-phase for larger properties) consumer unit setups installed by a qualified electrician range between £150 and £500+. Weigh this initial outlay against your realistic savings: eliminating a continuous 100W avoidable load could save around £230.56 a year, based on the average electricity unit rate of 26.32p/kWh under Ofgem’s price cap for 1 October to 31 December 2026, excluding standing charges. Actual savings and payback depend on your tariff and the load you can safely remove.
Schedule Your Free Consultation Today!
What kind of product or solution are you interested in?
Conclusion
A home energy monitor gives you a much clearer idea of how much electricity you’re using and where you can save. By tracking your habits, spotting wasted power, and making the most of off-peak rates, you can keep your bills in check. Got solar or a battery? It’ll also show you how much you’re generating, using, and storing. What you go for just depends on your needs, your setup, and your budget.
FAQs
Do Home Energy Monitors Use Much Electricity?
Power consumption depends on the model. For illustration, a monitor drawing 0.5W to 3W continuously uses 4.38 to 26.28 kWh a year, costing about £1.10 to £6.57 at 25p/kWh. Check the manufacturer’s specification and your tariff; savings are not guaranteed.
Are Home Energy Monitors Worth It?
They can be, if the information helps you reduce avoidable consumption. Savings and payback depend on the monitor’s cost, your tariff and the changes you make; a fixed percentage saving or payback period cannot be guaranteed.
Can an Energy Monitor Help Households Using Economy 7 Tariffs?
Yes, energy monitors are particularly effective for Economy 7 and dynamic smart tariffs because they allow you to verify that heavy loads run strictly within your cheaper night hours. Many modern monitors let you program split tariff rates so you can see live monetary costs change between day and night periods.
How Accurate Are Home Energy Monitors?
Accuracy varies by model, calibration, installation and load; check the manufacturer’s stated measurement conditions. Basic clamp models that estimate voltage rather than measuring it live may show slight variations during grid voltage fluctuations, while direct-wired sub-meters should be assessed against their own accuracy specifications.
How Do You Install a Home Energy Monitor?
Installation depends on the model: optical LED pulse readers stick straight onto your existing meter with adhesive pads in minutes, while CT clamp systems clip around the insulated main meter tails near your consumer unit. If you need internal consumer unit installation or direct voltage tapping, hire a qualified electrician familiar with the electrical requirements in your part of the UK to handle the work safely.

