Average Electricity Bill in Sydney: Typical Costs and What Affects Your Bill
Electricity bills in Sydney vary depending on household size, how much power you use, your rates, and seasonal heating and cooling needs. According to Solar Calculator’s Sydney electricity bill analysis, the average Greater Sydney household pays around $636.95 per quarter, or $2,547.79 per year, including supply charges. This guide covers typical electricity costs, explains what drives household electricity bills, and outlines practical ways to manage energy spending through better plans, energy-efficient habits, and solar power.
Key Takeaways
Average electricity costs: Greater Sydney households pay an average of $636.95 a quarter, or $2,547.79 a year, including supply charges.
Household size: Daily use runs from around 8 to 9 kWh for one person to over 24 kWh for a family of five or more.
Location matters: Western Sydney’s temperature extremes can push heating and cooling costs higher.
Solar savings: Solar Calculator estimates that a 6.6 kW solar system can save an average Sydney household around $1,185 a year, although actual savings vary by household.
Smart energy management: The EcoFlow PowerInsight 2 helps you monitor usage, while the OCEAN 2 Plus stores excess solar for later.
What Is the Average Electricity Bill in Sydney?
The average Greater Sydney electricity bill is around $636.95 a quarter, or $2,547.79 a year, according to Solar Calculator. What you actually pay depends on how much power your household uses, your retailer’s pricing, and the local distribution network. Compare those figures with your own bill to see whether your costs are running higher than they should be.
Typical Quarterly and Annual Electricity Costs
For most Sydney homes connected to the grid, the average electricity bill is around $636.95 per quarter, or $2,547.79 a year, according to Solar Calculator. These figures include daily supply charges. Your actual bill will depend on your household’s electricity consumption, retailer pricing, and electricity plan.
Average Electricity Bills by Household Size
Household size is an important factor in electricity consumption. Solar Calculator’s Greater Sydney benchmarks show how average daily electricity use and bills vary across households with different numbers of occupants..
| Household Size | Daily Electricity Use | Monthly Bill | Quarterly Bill |
|---|---|---|---|
| 1 Person | 8.52 kWh | $123.10 | $369.30 |
| 2 People | 14.35 kWh | $188.23 | $564.69 |
| 3 People | 17.43 kWh | $222.64 | $667.91 |
| 4 People | 20.03 kWh | $251.70 | $755.11 |
| 5+ People | 24.68 kWh | $303.64 | $910.93 |
How Household Electricity Use Varies Across Sydney
Where you live in the Greater Sydney basin directly impacts how hard your appliances have to work. Coastal and Eastern Suburbs homes benefit from reliable sea breezes that take the sting out of sticky February afternoons. Head out past Parramatta toward Penrith, Blacktown, or Campbelltown, however, and summer temperatures regularly climb 5°C to 8°C higher than the coast, while winter mornings can drop down to frost level. Consequently, Western Sydney residents rely far more heavily on ducted air conditioning, pushing their seasonal power usage well above their coastal counterparts.
What Factors Affect Your Sydney Electricity Bill?
Sydney electricity bills come down to how much power a household uses, when it’s used, and what the retailer charges. Heating and cooling needs, appliance efficiency, tariff structures, and rooftop solar all shape the final amount. Understanding those factors helps explain why your bill looks different from your neighbour’s, and why it changes from one quarter to the next.
Daily Habits and Household Electricity Consumption
Appliances left humming in the background silently chew through power. A second drinks fridge out in the hot garage, heated towel rails left on 24/7, or older cathode-style bar heaters can add hundreds of dollars across a billing period. Similarly, leaving pool pumps running during peak tariff periods adds an unwelcome surcharge to suburban properties.
Seasonal Heating and Cooling Demand
Sydney weather rarely stays mild for an entire year. Winter bills frequently jump when portable electric heaters are dragged out of storage to warm poorly insulated, high-ceiling brick homes. In summer, running multiple split systems for hours on end to beat 38°C humidity spikes creates an inevitable surge on your invoice.
Electricity Rates and Tariff Structures
The plan you signed up for determines how much you pay for every kilowatt-hour consumed.
Single Rate Tariffs: You pay a flat rate per kWh regardless of when you boil the kettle or start the dryer.
Time-of-Use (ToU) Tariffs: Rates fluctuate across peak, shoulder, and off-peak windows. In Sydney, peak hours typically strike between 2:00 PM and 8:00 PM on weekdays, where electricity can cost over 45c/kWh. Off-peak overnight power, by comparison, drops closer to 20c to 25c/kWh.
Standing Offers vs. Market Contracts: Households that have not switched providers in over two years often slide onto the default offer, paying substantially more than the sharpest market rates.
Solar Self-Consumption and Grid Imports
With feed-in tariffs varying across NSW electricity plans, exporting daytime solar back to the grid may earn less than the cost of buying electricity later. The real economic gain often comes from self-consumption—running appliances directly from your panels while the sun shines, which can offset grid purchases. For households that use most of their electricity after sunset, solar battery storage may provide another way to use surplus daytime generation later rather than relying as heavily on grid electricity.

Is Your Electricity Bill in Sydney Higher Than Normal?
A higher electricity bill does not always mean your household is using more power. Changes in electricity rates, billing periods, estimated meter readings, or appliance performance can also increase costs. To identify the cause, compare your daily electricity consumption with previous bills and similar households, then check your current rates and any unusual changes in usage.
Compare Your Usage With Similar Households
Look at the graph on the second page of your power bill. Australian energy regulations require retailers to display a comparative breakdown benchmarking your daily kilowatt-hour consumption against single-person, small-family, and larger households in your local postcode. If your home uses 28 kWh a day while your neighbours average 16 kWh, excess consumption is your culprit rather than retailer rate changes.
Check Your Rates, Fees and Bill Period
Bills are not always apples-to-apples comparisons. First, check the number of billing days: a 94-day quarterly cycle will naturally look much heavier than an 86-day period. Next, ensure the meter read says Actual rather than Estimated. An estimated read based on previous seasonal spikes can artificially inflate what you owe until a technician takes a physical read or your smart meter syncs up.
Investigate Sudden Increases in Electricity Use
Unexplained bill surges often point to appliance faults or hidden draws. A split or leaking hot water relief valve can cause an electric storage system to continuously heat fresh cold water all day. Similarly, an aging ducted air conditioning compressor running low on refrigerant will strain harder and draw continuous peak current to cool the house.

How Can You Reduce Your Electricity Bill in Sydney?
Sydney households can cut power costs by comparing retail plans, improving appliance efficiency, and shifting when they use electricity. For households with a 6.6kW solar system, using solar power when it is generated can reduce the amount of electricity they need to buy from the grid, while a battery can store excess generation for later use. The best approach depends on your energy needs, your tariff, and what gear you’ve already got.
Compare Electricity Plans for Your Address
Review your electricity plan at least once a year using Energy Made Easy, the government’s free comparison tool. Compare daily supply charges, usage rates, and discounts against the reference price, not just the promotional offers. Switching retailers in NSW generally won’t interrupt your supply, and a more competitive plan can cut your annual costs without you changing a thing about how you use power.
Track Household Energy Use to Find Savings
Knowing when and how your home uses power helps you spot waste and shift usage to cheaper periods. The EcoFlow PowerInsight 2 has an 11-inch touchscreen that shows real-time electricity use and solar generation when connected to compatible systems. Sydney homeowners can use that data to track patterns, spot high-demand periods, and adjust appliance schedules. Actual savings depend on your habits, your tariff, and how the system’s set up.
Reduce Heating, Cooling and Appliance Costs
Heating and cooling can eat up a big chunk of your power bill. In summer, set the air con to 24–25°C instead of 19°C. In winter, keep reverse-cycle around 20°C. Clean the filters, close the blinds on hot afternoons, and turn off what you’re not using. Small habits, real savings.
Shift Flexible Electricity Use to Cheaper Periods
If you’re on a time-of-use tariff or have solar, when you run your appliances matters. Washing machines, dishwashers, and pool pumps can all be shifted to cheaper periods. For solar households, running them between 10 AM and 2 PM makes the most of your own generation. Otherwise, check your retailer’s off-peak hours and plan around those.
Make Better Use of Rooftop Solar Energy
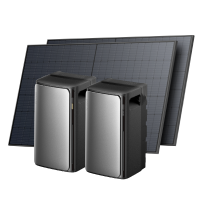
Rooftop solar cuts the electricity you need to buy from the grid while your panels are generating power. But come evening, when generation drops off, you may still need grid electricity. A suitable battery can store surplus daytime solar power for later use, depending on system capacity and household demand. For households comparing available options, EcoFlow solar battery solutions offer one avenue to explore how solar generation and home storage can work together.
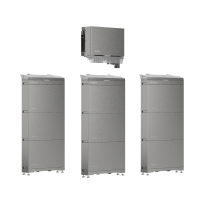
The EcoFlow OCEAN 2 Plus Single Phase offers expandable storage up to 96 kWh, so you can size it to your needs and your solar setup. For Sydney homes with higher demand, air con and EV charging included, pairing solar with the right battery means more self-consumption and less reliance on the grid. Actual savings come down to system sizing, how you use power, and your tariff.
Schedule Your Free Consultation Today!
What kind of product or solution are you interested in?
Conclusion
The average Sydney electricity bill gives you a useful benchmark, but what you actually pay depends on household size, daily usage, and the plan you’re on. Review your tariff, cut back on unnecessary appliance use, and shift flexible electricity use to cheaper periods to bring ongoing costs down. If you’ve got rooftop solar, monitoring your usage and considering a battery may open up more ways to cut grid purchases. And keep checking your usage and comparing plans throughout the year. It’s not a set-and-forget exercise.
FAQs
How Long Does a Solar Panel Take to Pay Itself Off?
A typical residential solar system in Sydney pays itself off in about 3 to 5 years. A quality 6.6 kW installation costs roughly $4,500 to $6,500 after federal STC incentives. Families who use a decent chunk of their generated power during the day save between $1,000 and $1,500 a year on bills.
How Long Will a 10kWh Battery Last?
A 10kWh battery will comfortably run essential circuits in an average home for about 12 to 24 hours during a blackout, or cover a standard family’s evening and overnight use from sundown to sunrise. Fire up heavy continuous loads like ducted air con, electric oven ranges, or pool heaters, and you’ll typically drain it in 3 to 5 hours.
How Much Cheaper Is Your Electric Bill with Solar Panels?
For a typical household without a battery, a well-sized solar system usually cuts power bills by 30% to 50%. Daily supply charges stay fixed, and most families use the bulk of their energy in the early morning and evening. Households with someone home during the day to run appliances sit at the higher end of that range. Add a battery to capture surplus daytime generation, and bill reductions can push past 70% to 85%.
Is It Cheaper to Install Solar Panels and a Battery Together?
Yes. Bundling solar and battery installation is significantly cheaper than adding a battery later. Doing both at once saves on shared labour, site fees, and certification costs. It also lets the installer use a single hybrid inverter instead of retrofitting extra hardware down the track.
How Much Does It Cost to Run an AC for 8 Hours?
Running a standard modern 2.5 kW to 3.5 kW split-system air conditioner for 8 hours costs roughly $1.80 to $3.50, depending on your tariff and set temperature. For larger whole-home ducted systems (10 kW to 14 kW cooling capacity), running the compressor for 8 hours will cost between $6.00 and $12.00+.